10.The operating surface
Around the assessment, the rest of the platform.
The scan is the centre. These are the surfaces that commission it, explain it, teach it, and carry the record into the tools you already run.
Hacker-team engagement
After the breaker swarm merges its findings, a commander sends specialist operatives back at the same result. An operative that finds a seam can spawn its own, down to a fixed depth, inside one shared session and one time budget.
- Six clusters, chosen by target kind: web, AI, cloud, network, identity, and code
- Each cluster has its own specialists — injection and authz on web, prompt and tool abuse on AI, IAM and storage on cloud, and so on
- A budget on the commission form stops the run cleanly when the clock runs out
- The assessment page keeps the commander summary, the operative table, and a downloadable engagement PDF
Attack this campaigns
One authorization covers every registered target in the organisation. The campaign fans those targets through the existing scan pipeline and streams progress as it moves from scope to report.
- Phases run scope, recon, attack, impact, chaining, then report
- Impact proofs stay bounded and non-destructive: capability evidence for exfiltration, defacement, and denial of service
- A proof that cannot be confirmed degrades to a candidate marker instead of a verified finding
- Verified SQL injection reads database metadata only — server version, names, and counts — never row values
Pencheff Academy
A free, hands-on ethical-hacking course at /academy. Lessons are written against real lab output, not invented screenshots, and sign-in is the same account as the rest of Pencheff.
- Progress is stored per user and resumes on the next visit
- A lab file named in a lesson downloads in one click
- academy.pencheff.com redirects to pencheff.com/academy
Licensed enterprise self-host
Community Edition remains a Docker Compose stack under AGPL-3.0, with no licence fee. Enterprise images live in a private registry and are pulled only after the org API key is accepted.
- The key is the registry credential; a non-enterprise or revoked key cannot fetch the images
- Images are pre-built, so a configuration change takes effect on restart
- Data stays inside the boundary you operate
Email notifications
Three opt-in mail flows. When mail is not configured, the rest of the platform keeps running and nothing is sent.
- Scan-completion mail, chosen at commission time, on done and on failed
- A Monday digest per target for the past seven days of grades and severity counts
- A Monday digest per workspace covering every active target
- Recipients can be workspace members or any address you type
Visual dashboards
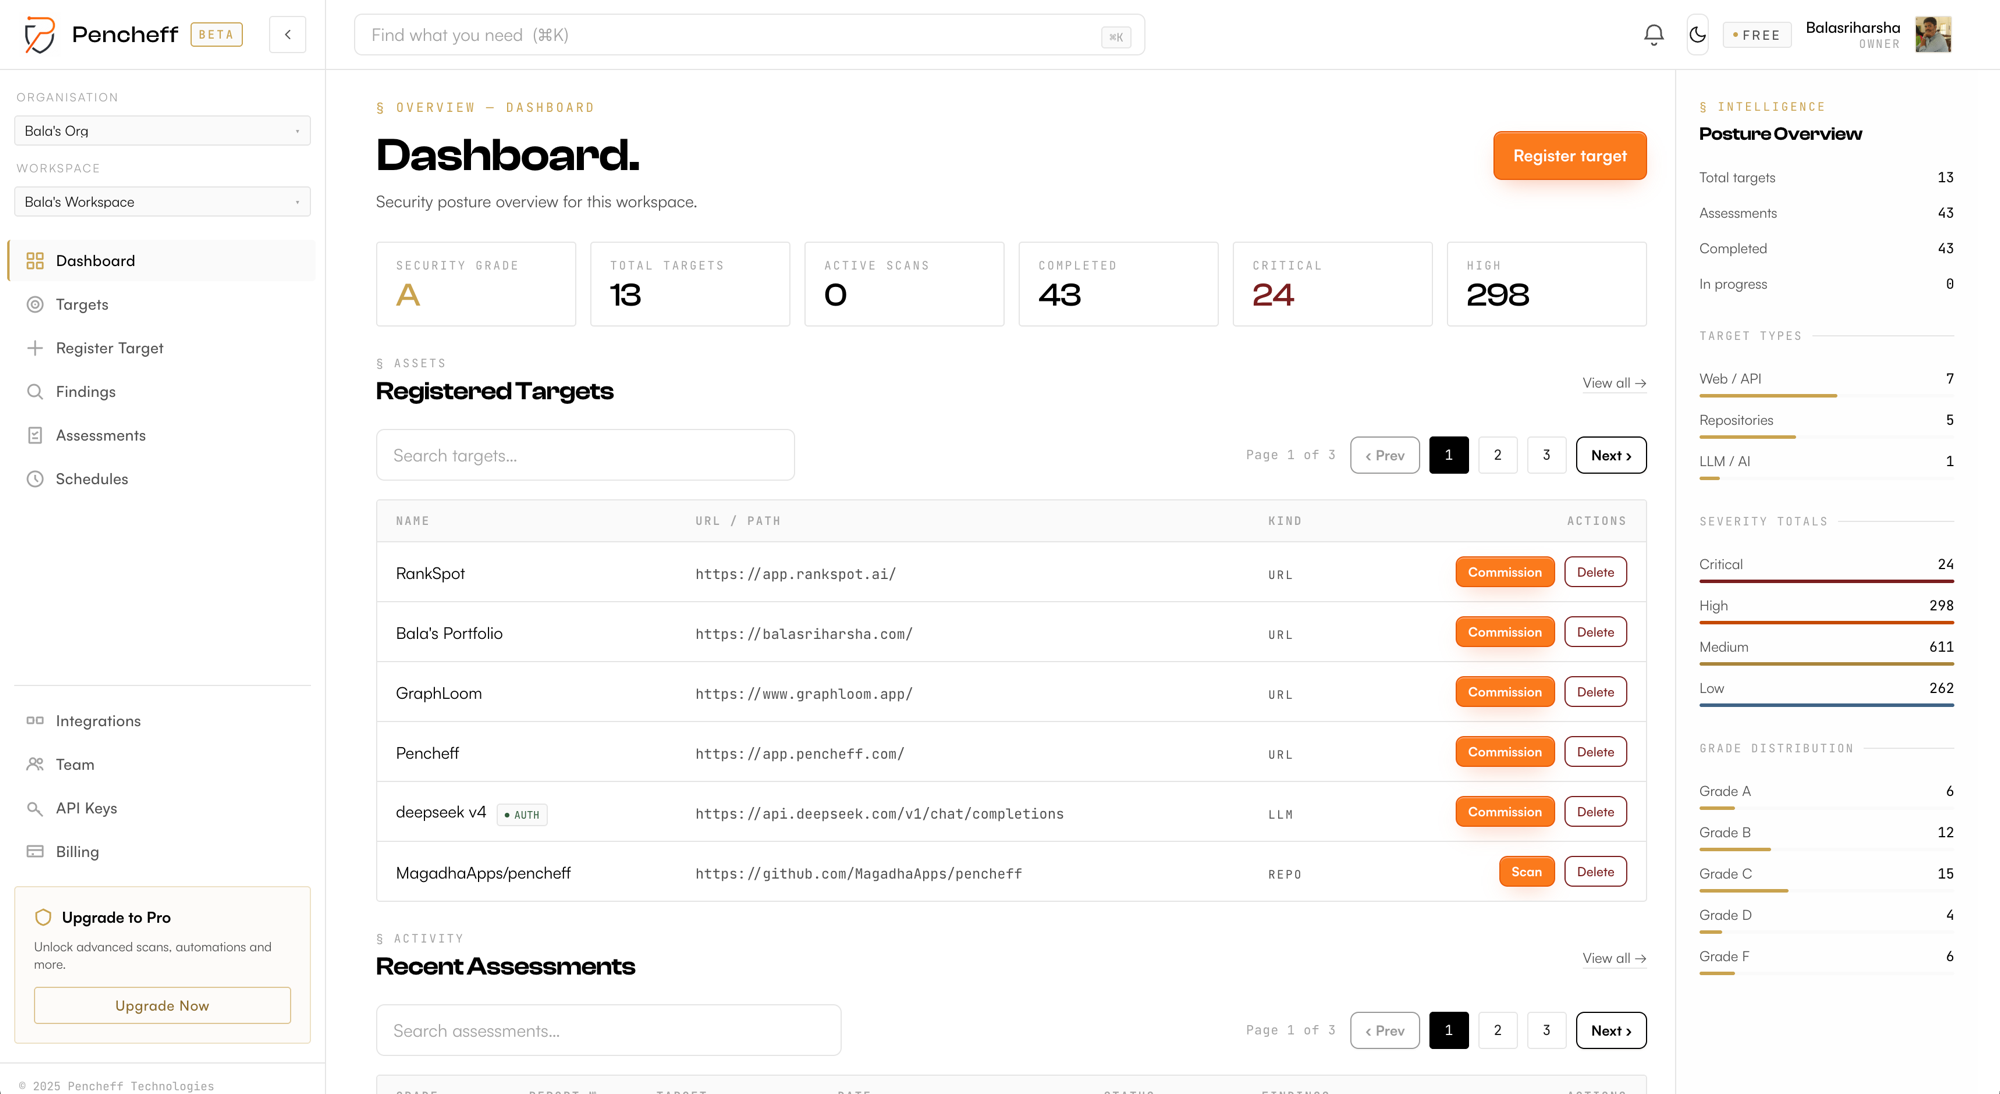
The same numbers as the findings register, drawn so a stakeholder can read them in a few seconds. Charts render only after a scan finishes.
- Per-scan: severity, CVSS, verification, OWASP coverage, top risks, and an endpoint treemap
- LLM targets swap in a red-team layout: verdicts, attack-success heatmap, strategy breakdown, judge confidence, and token latency
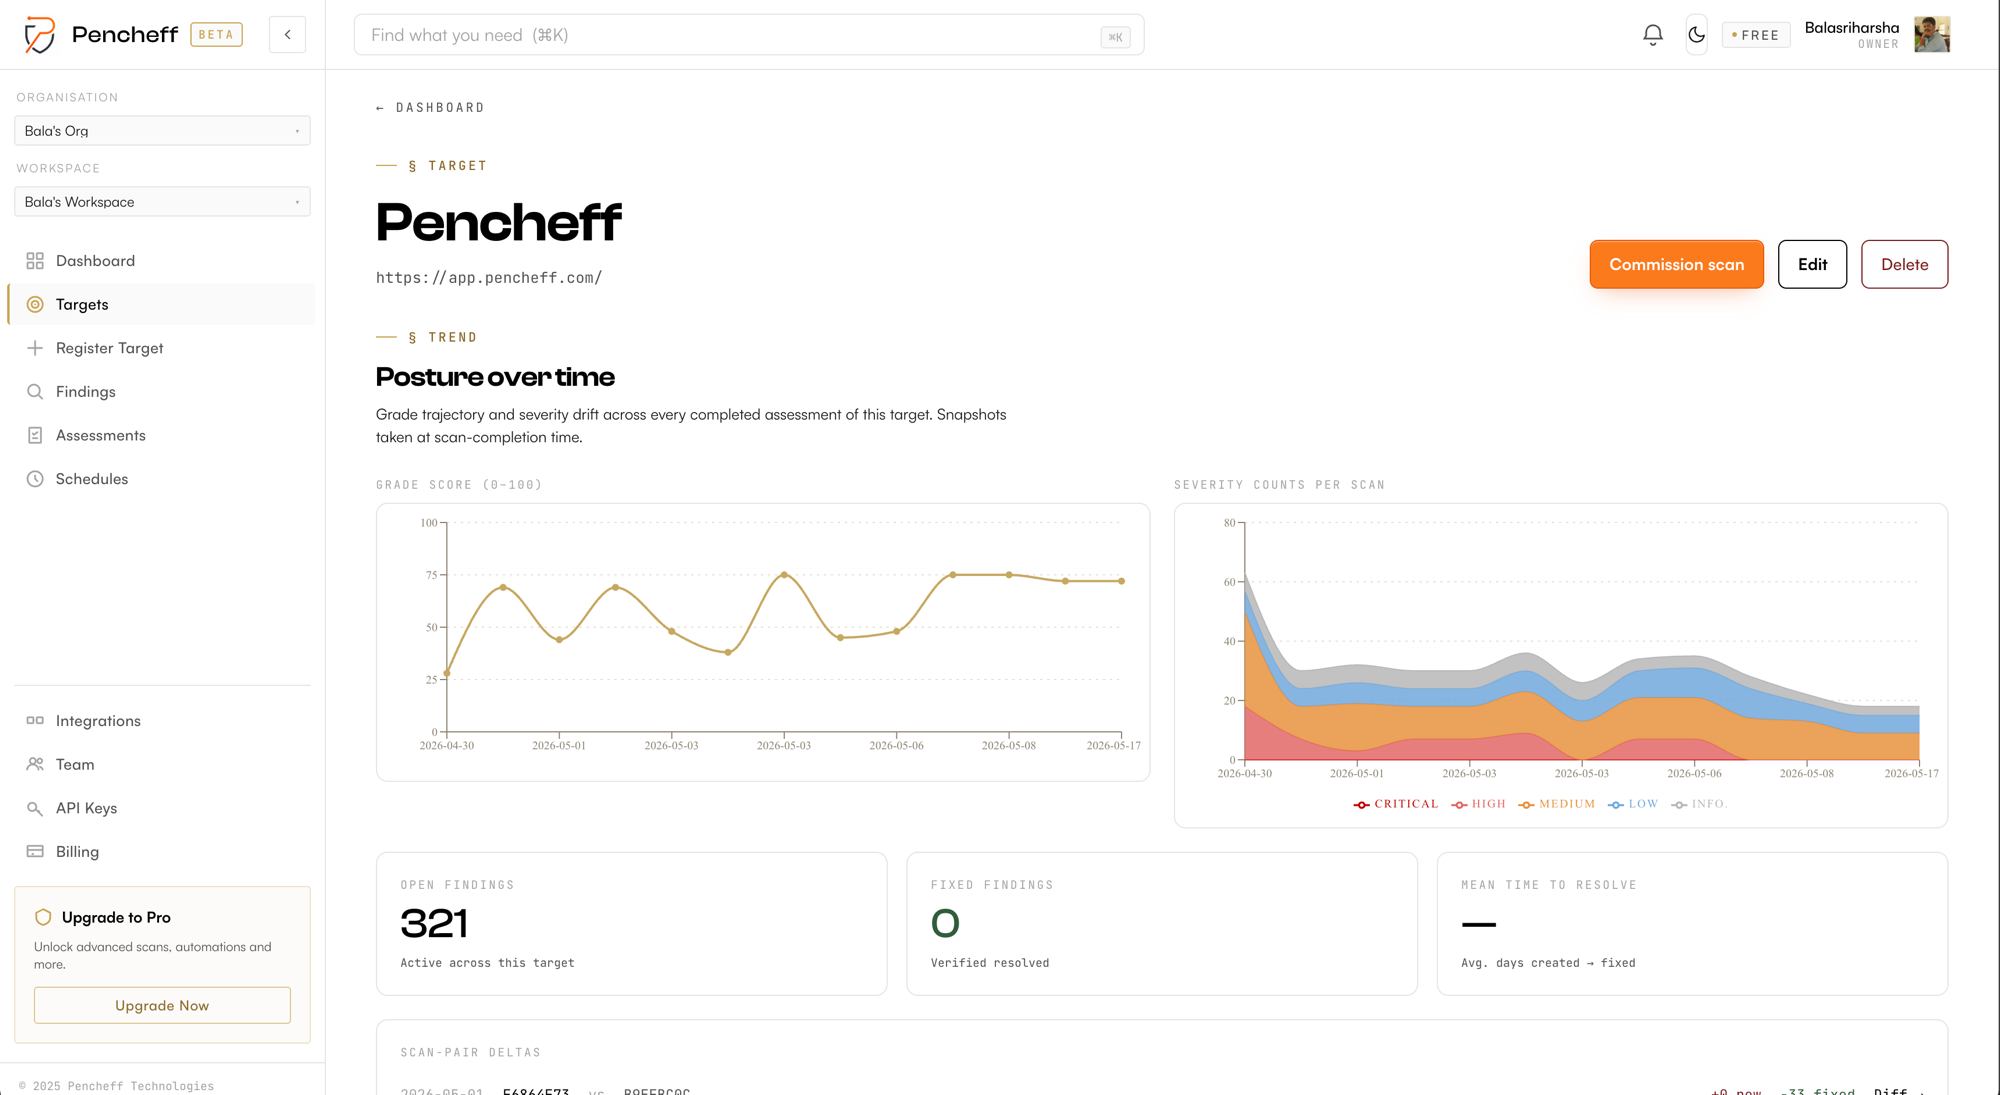
- Per-target trend: grade over time, severity stack, MTTR, and new / fixed / regressed between scans
- Per-repo and executive views for scanner effort, CVE fix status, and org-wide risk
Platform observability
Opt-in traces, logs, and metrics across the API, workers, the MCP plugin, external tool runs, and agent turns — plus a tamper-evident audit log. Off by default, so a stock install pays nothing for it.
- Day-partitioned traces, logs, and metrics in the existing Postgres database
- Audit rows for mutating API calls, chained with a hash so a gap is visible
- In-app views for SLOs, cost, and the trace of a single scan
- OpenTelemetry export remains available for Datadog, Splunk, and the rest of your collector
Partner pentest triage
A finding can be handed to a human pentest partner without leaving the record. The callback updates verification when their triage comes back.
- HackerOne, Bugcrowd, and Cobalt
- Signed webhooks on the way out and on the way back
- Verification status flips from the partner result; the finding stays in the same register
API discovery from live traffic
Separate from the crawl. Traffic captured by the browser-extension proxy is turned into an OpenAPI 3.1 description of what the application actually served.
- Paths, methods, status codes, and response shapes are inferred from the captured flows
- Drift against a declared spec surfaces shadow endpoints, phantom endpoints, and method drift
- The engagement keeps that discovered spec beside the assessment
Advisory pages
Every dependency advisory has its own page: the cached record, the NVD enrichment, and the priority signals used to decide whether it is urgent.
- EPSS, KEV, and SSVC on the same page as the advisory text
- An AI exploit walkthrough, with a provenance trail for what the model added
- Lookup by package and ecosystem, not only from inside a scan
IDE extensions
A language server publishes scan findings as inline diagnostics. The editor does not run the assessment; it shows the result on the line it belongs to.
- VS Code, JetBrains, Neovim, Emacs, and any other LSP client
- SCA findings highlight the package line in a manifest; SAST findings highlight the tainted line
- Hover text carries CWE, OWASP category, severity, and the remediation
- DAST findings stay on the dashboard — they have no local file to attach to
Active Directory paths
The swarm’s Active Directory breaker runs beside the other specialists when the engagement includes that surface. Findings land in the same register as the web and cloud results.
- Relationship paths across users, groups, and computers
- Certificate-template weaknesses
- SMB enumeration of what a found credential can actually reach
- Internal network as a registered target remains marked forthcoming